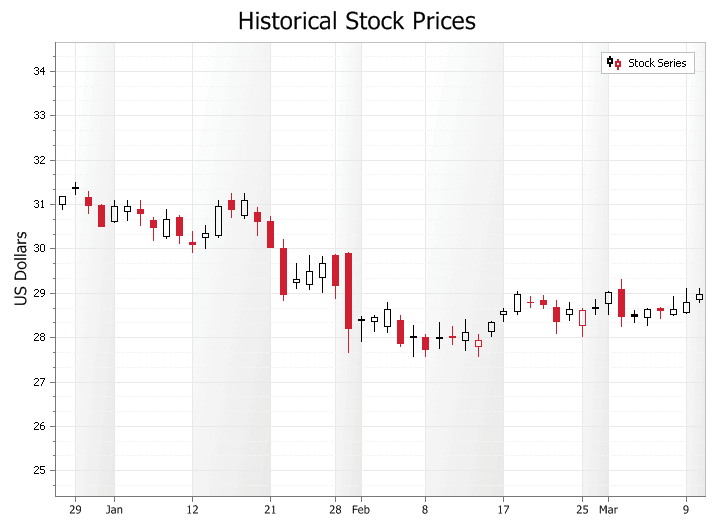
CandleStick Chart
A Candlestick Chart is used to display trends for financial data, generally stock market prices. Candlestick charts are much easier to rear than a traditional bar chart to a stock market trader. The candle sticks make it fast and easy to compare the high and low, open and close of data. Each "candle stick" represents the high, low, open and close of data for a given value. The relationship between these candles is important in determining trends among stock prices.