Standard Point Chart
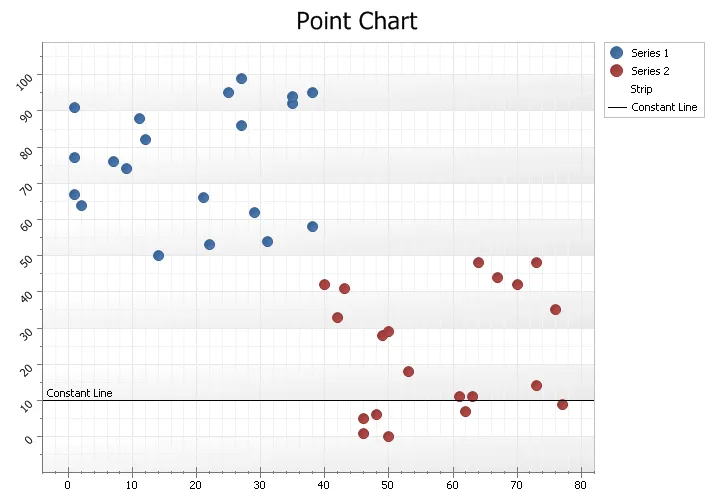
A point chart displays data in a grid using Cartesian coordinates. Data is displayed along the x and y axis, where x and y can represent any type of data. A point chart is also referred to as a plot or scatter chart.
A point chart displays data in a grid using Cartesian coordinates. Data is displayed along the x and y axis, where x and y can represent any type of data. A point chart is also referred to as a plot or scatter chart.